Quantitative Amplitude Interpretation toolkit
Quantitative Amplitude Interpretation toolkit
The QAI toolkit gives exploration and production teams the tools they need to find and delineate reservoirs, and to predict rock and fluid properties ahead of the drill bit. As part of the Sharp Reflections platform, the toolkit uses high-performance computing power (HPC) to deliver an unprecedented degree of interactivity, even on huge multiclient seismic datasets.
With its massive parallel computing engine, the QAI toolkit operates on prestack gathers and partial angle stacks with the power to leverage the full-fidelity amplitude information. Tools for locating and mapping promising seismic amplitude anomalies are combined with forward modeling tools to calibrate prestack amplitudes to well log data.
Go beyond traditional 3D data to interrogate huge multidimensional data volumes and rapidly screen for DHI and reservoir anomalies.
Other highlights include interactive spectral decomposition, versatile crossplotting, and a new multihorizon deck tool that enables automating amplitude analysis for a complete set of horizons.
The software’s high-performance computing power (HPC) and flexible data model allow you to extend interrogations beyond traditional 3D data to huge multidimensional data volumes, including azimuthal, 4D time-lapse and other 5D and 6D datasets.
Benefits
Offset-to-angle conversion and amplitude variation with angle (AVA) attributes
Multidimensional horizon interpretation and attribute analysis
Seismic forward modeling and well tie
Advanced cross-plotting

Powered by the QAI toolkit
Unlocking the value of multi-dimensional data
The flexible data model takes full advantage of high-performance computing power
Don’t let slow speeds and sluggish visualization impede your creativity. Use the Sharp Reflections QAI toolkit to quickly and easily manipulate huge multidimensional prestack and poststack data volumes with unparalleled workflow efficiency.
How does it work?
How does the QAI toolkit improve understanding of complex geological structures? Your industry colleagues asked for details; our experts answered. Join the dialogue…
What are the added benefits of using prestack data in my interpretation work?
Your Subtitle Goes Here

If you have elastic well log data available in your area, then Sharp Reflections has a number of QAI tools to help you understand your expected prestack seismic response and determine which prestack attributes may be useful for reservoir and fluid interpretation.
- Elastic well log cross plots can help determine whether it is possible to differentiate lithologies and fluids from their elastic properties.

Well log zonation for elastic property cross-plotting
- Prestack synthetic well-to-seismic ties help you understand whether those differences can be detected at the seismic bandwidth, and whether the seismic data is of a sufficient S:N level to detect the expected response shown in our prestack synthetics.
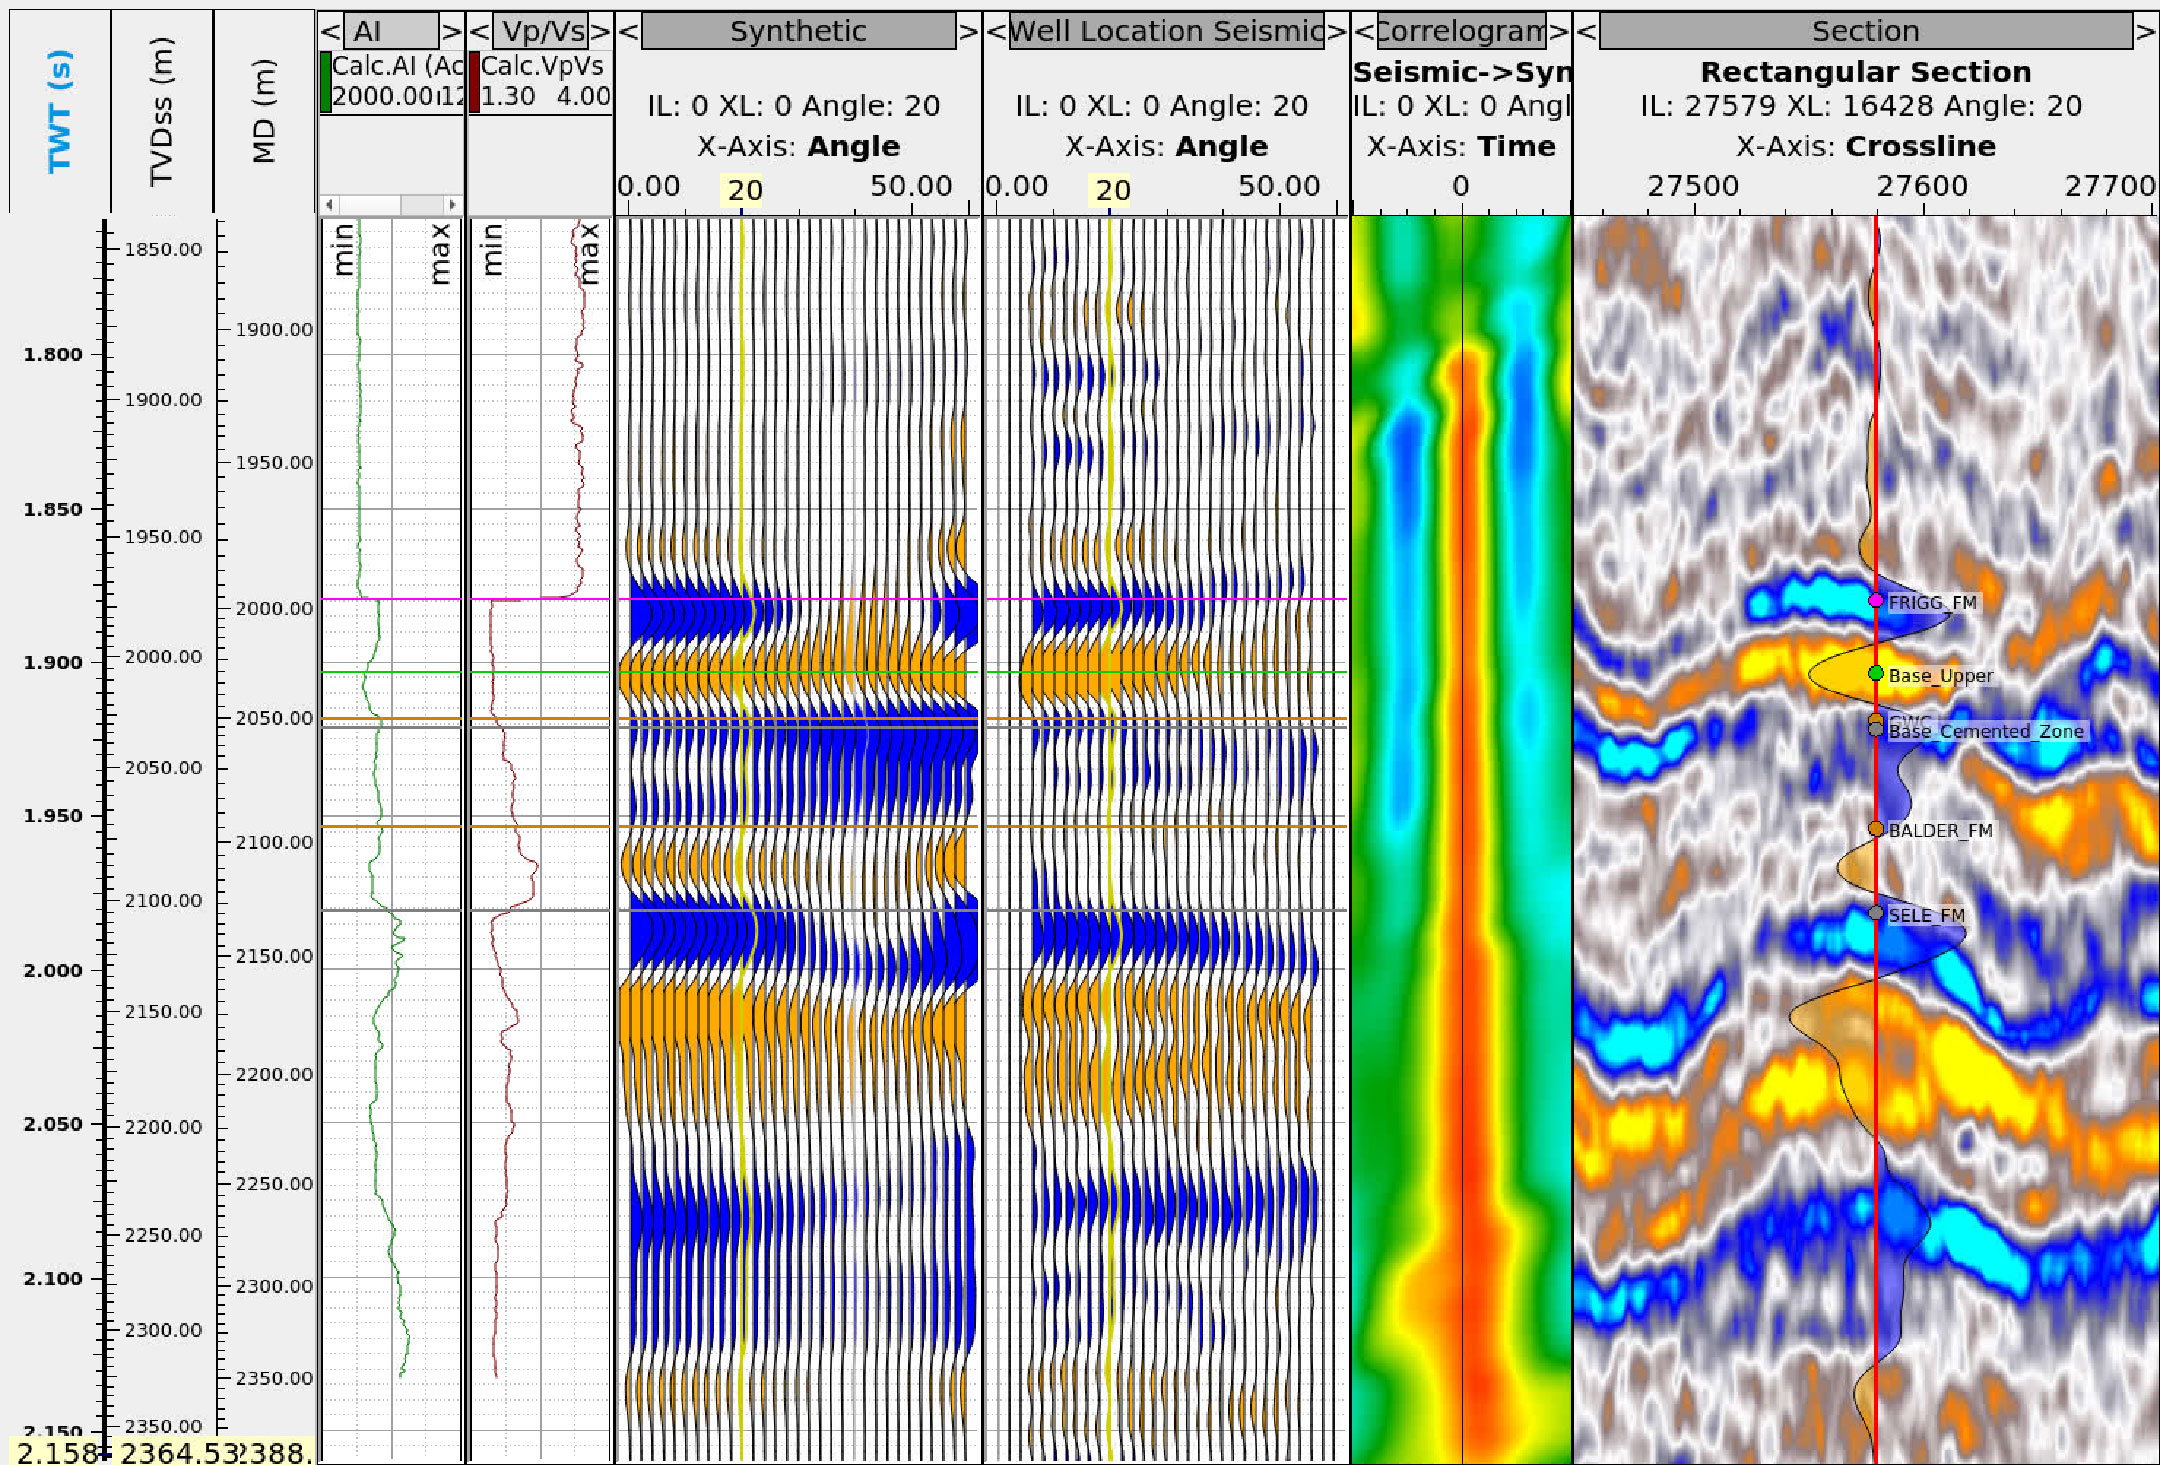
Prestack well-to-seismic tie
- 3D parametric modeling facilitates further understanding of expected prestack response by generating synthetic “what-if” scenarios, such as changes in thickness or fluid saturation of your target reservoir. This kind of modeling helps to establish which scenario changes could be discriminated in your recorded prestack data.

3D prestack parametric modeling of thickness and saturation changes
How should I interpret my prestack dataset?
Your Subtitle Goes Here

There are many ways to interpret the prestack response within your 3D dataset with the QAI toolkit. Horizon tools can be used to pick and autotrack events on any stack or gather volume, which can then be used to extract attributes from your data.
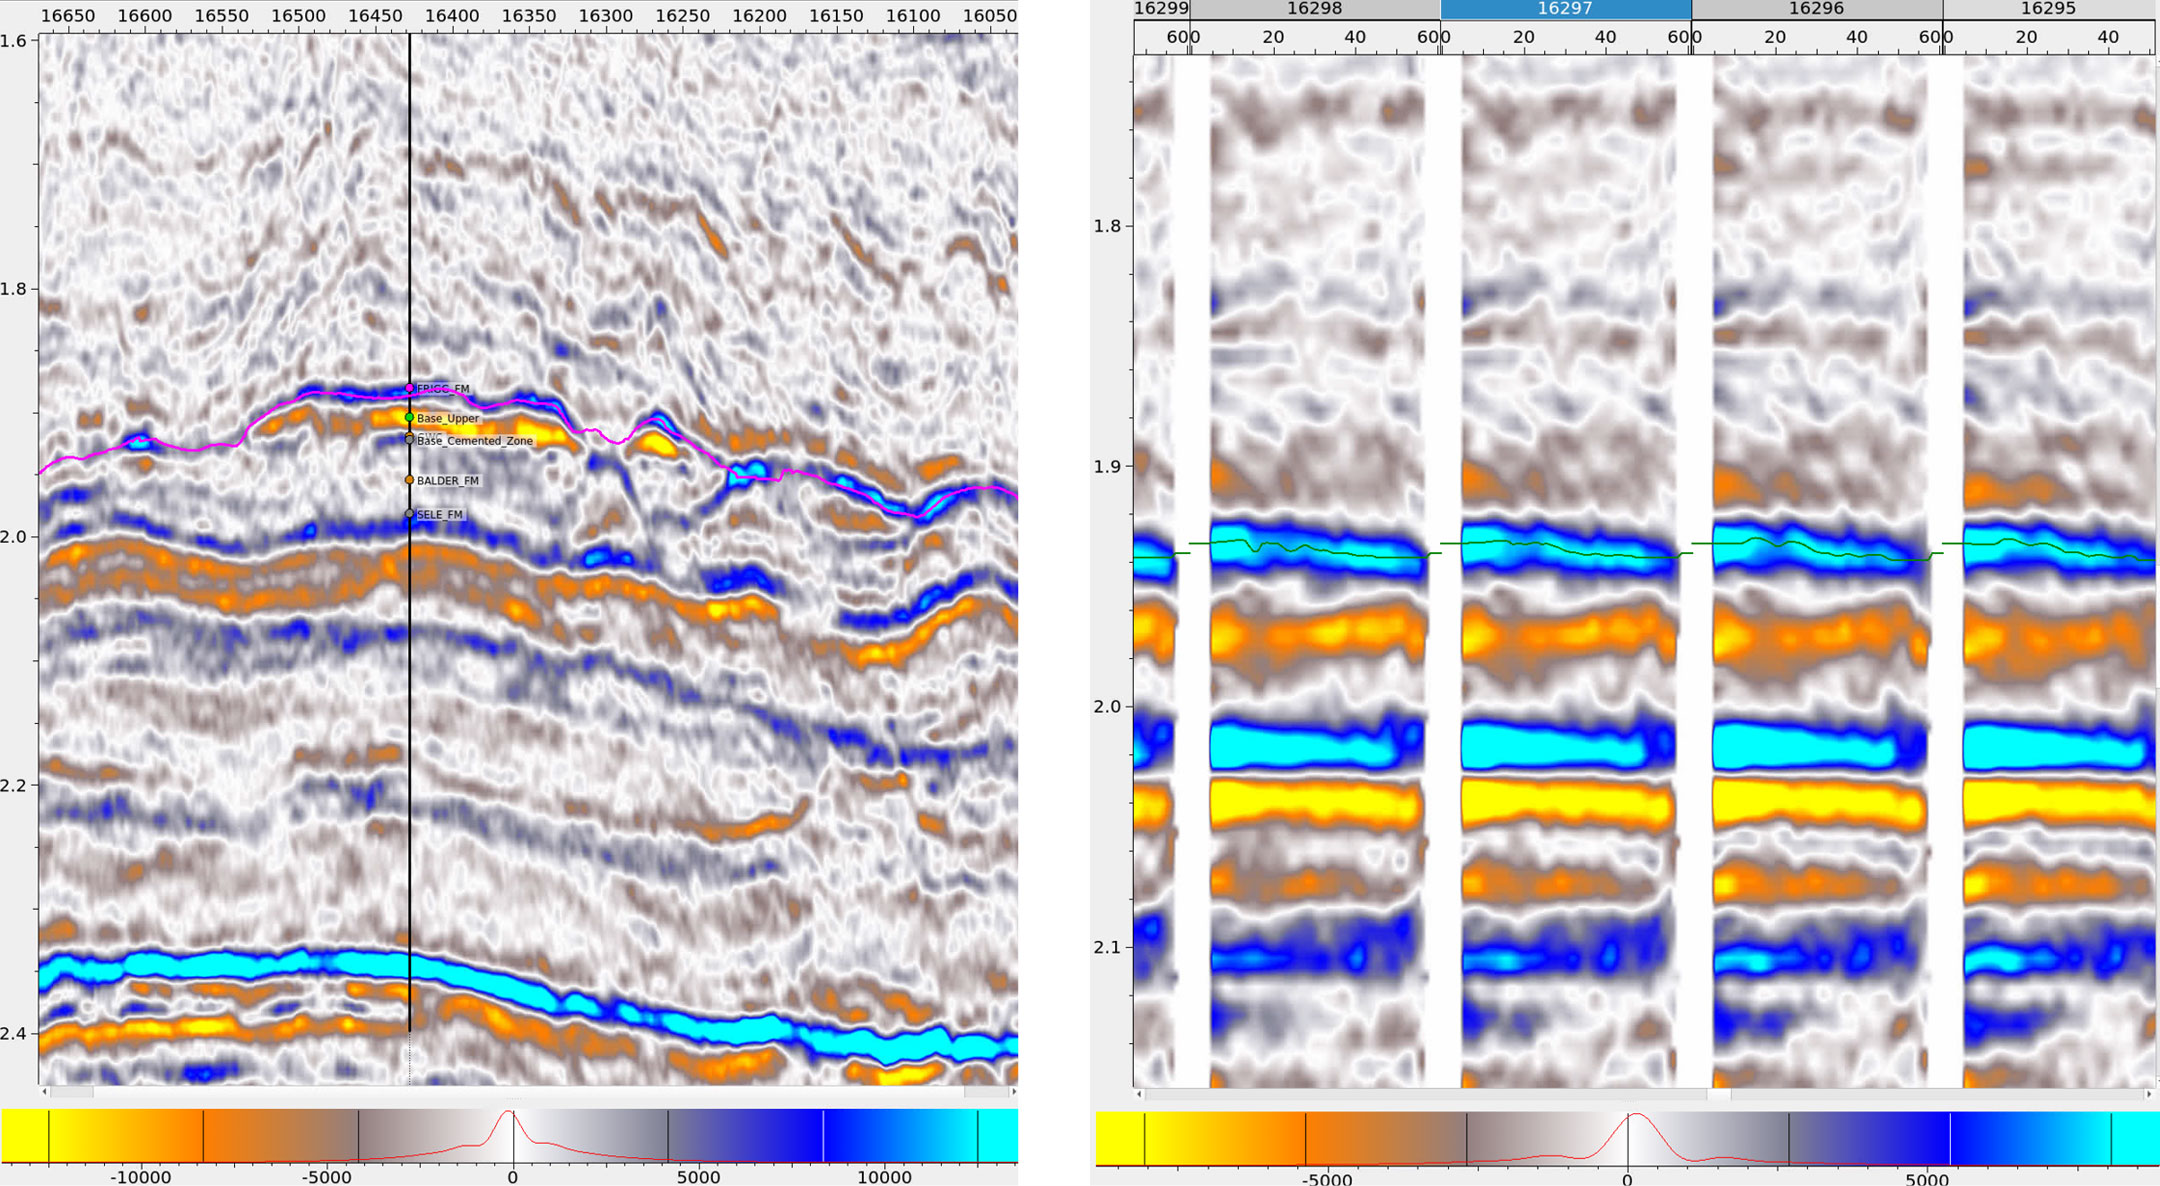
Pick on stacks (left) Pick on gathers (right)
Migrated gathers are loaded as a single data object. You can perform attribute extraction at all angles within the gather volume in a single, instantaneous computation. Panning through the extracted attributes by angle in 2D or 3D viewers provides rapid insights into amplitude vs angle (AVA) behavior at your target.

Amplitude extraction at target direct from angle gathers
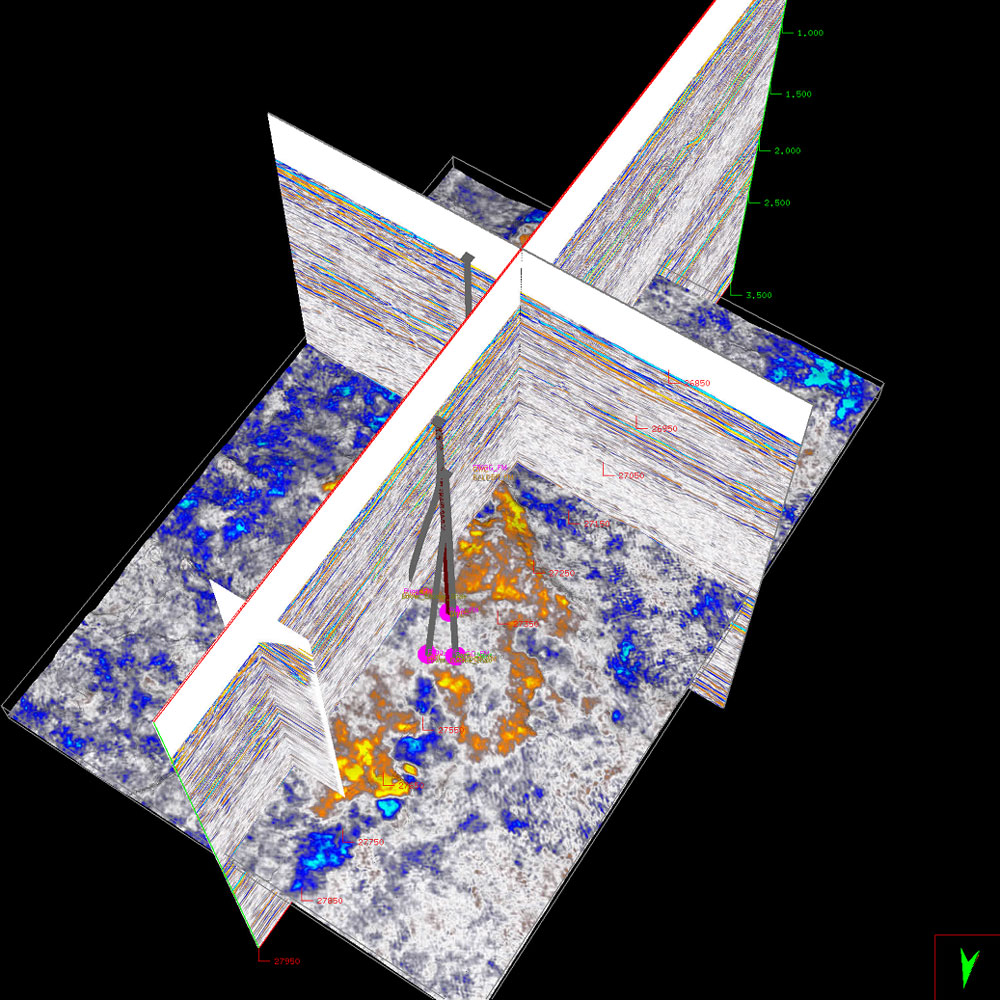
Screening prestack response in a 3D viewer
Which amplitude variation with angle (AVA) attributes can I use to best advance my interpretation?
Your Subtitle Goes Here

A full suite of two-term and three-term AVA attributes can be generated directly from your input gathers, on the fly in real time. These attributes can be analyzed on a volumetric and target horizon basis to gain further insights into your reservoir targets.
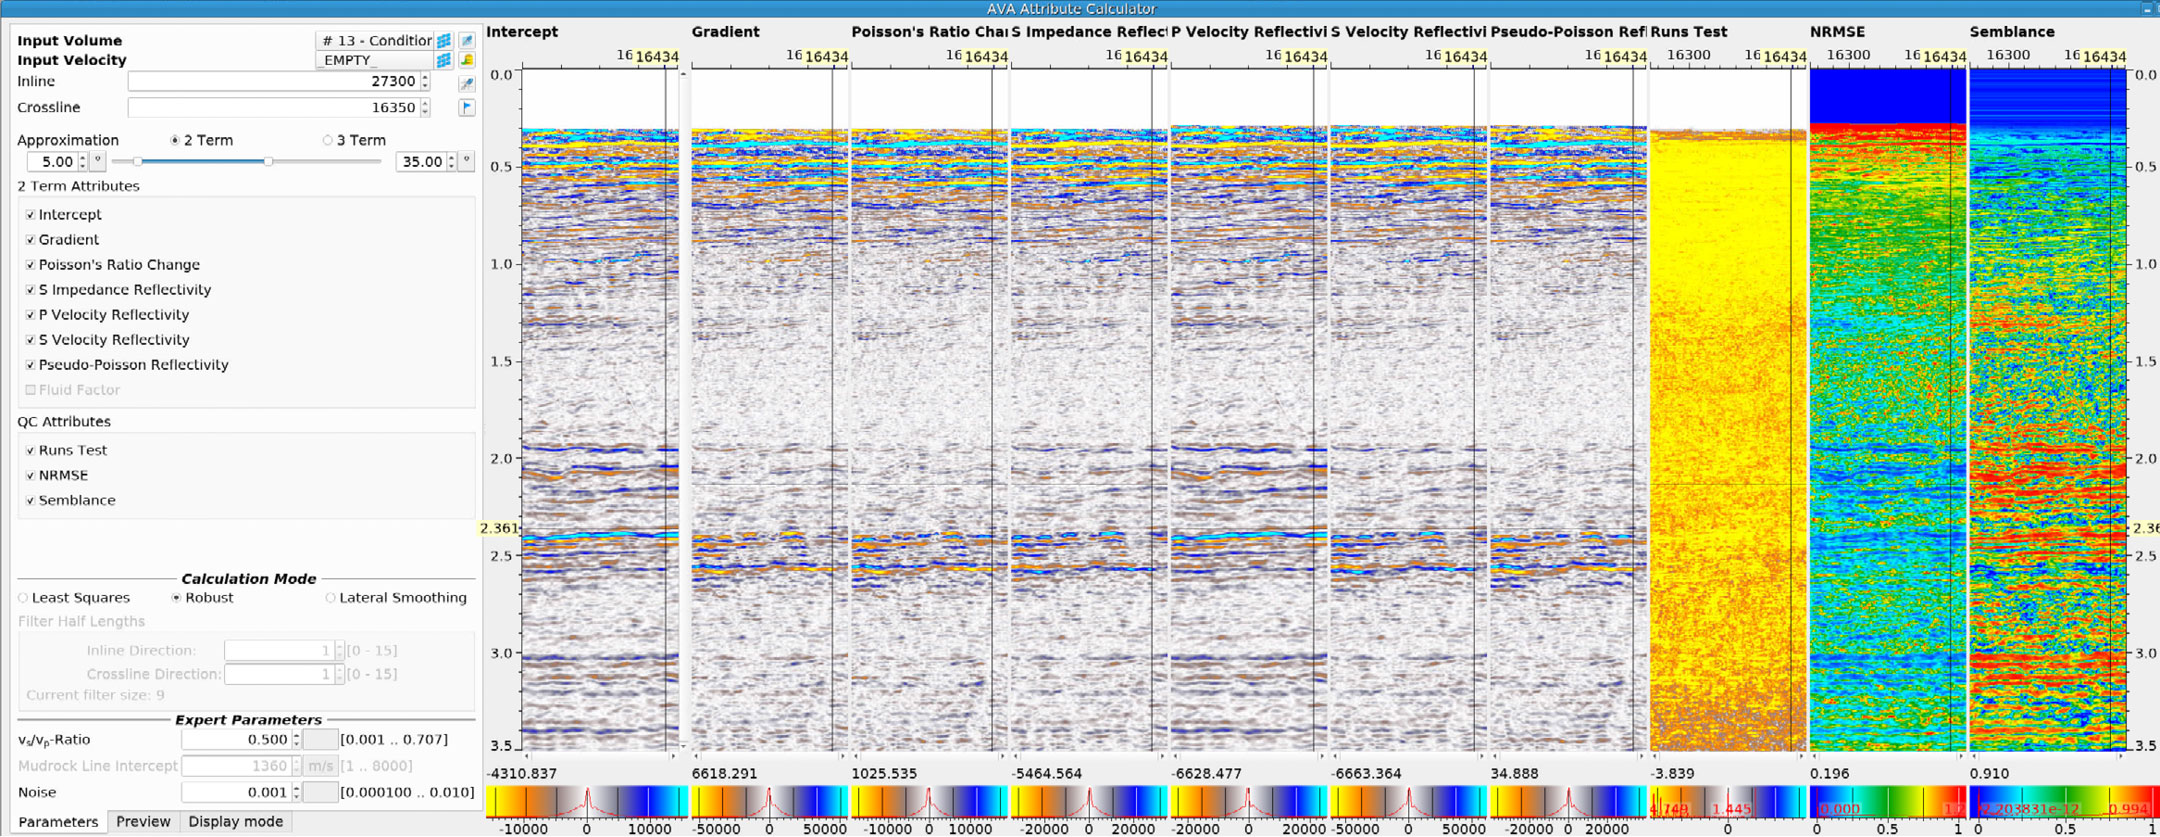
Simultaneous generation of multiple AVA attributes directly from input gathers
Cross-plot polygon masking of attributes such as intercept and gradient is another interactive real-time way to screen prestack data for evidence of reservoir or fluid signals within the Sharp Reflections QAI environment. Cross-plot polygons can be edited to provide real-time updates in the map viewer, and vice versa, to reach deeper understanding of prestack response.
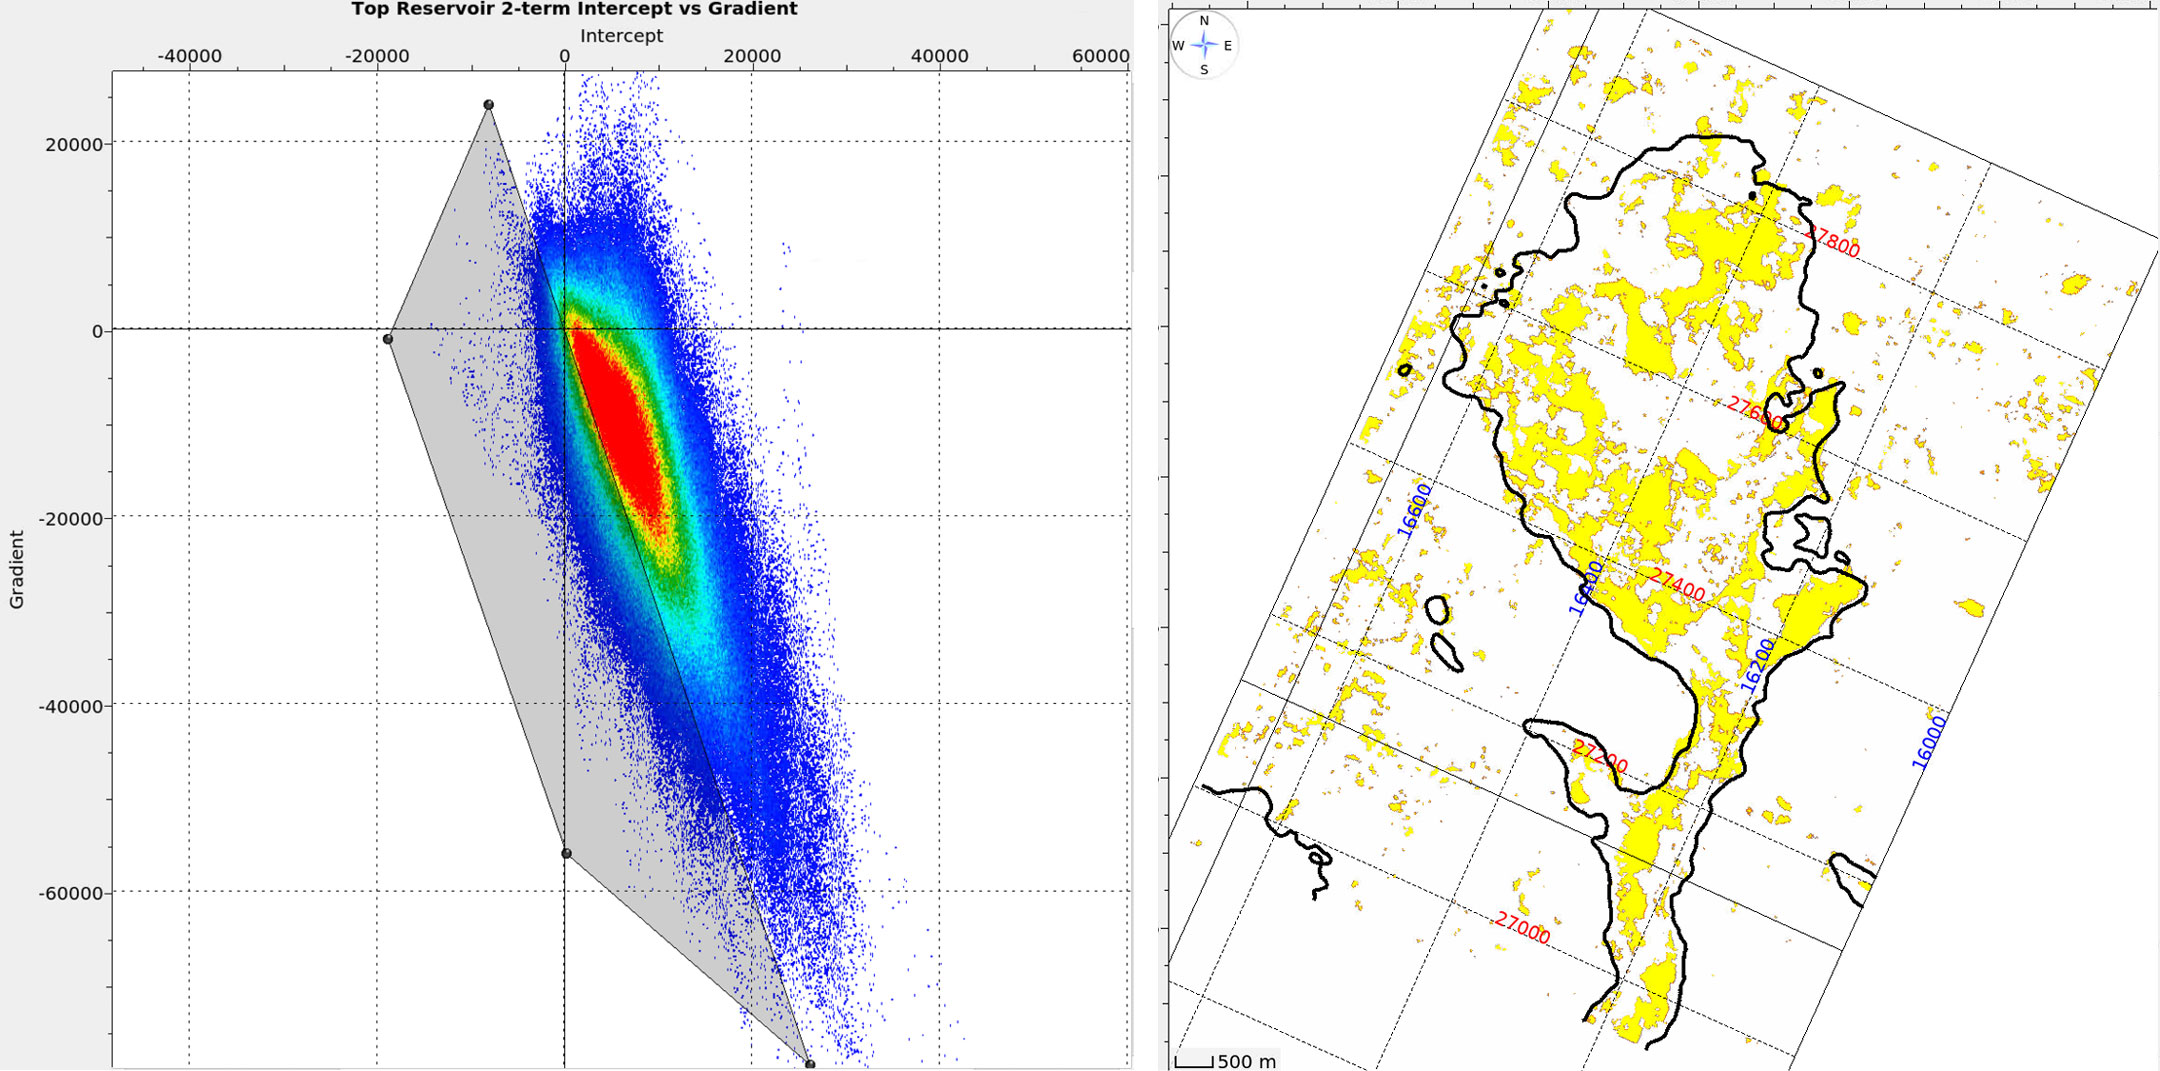
Cross-plot polygon masking for fluid anomalies
AVA attribute cross-plot rotations such as Chi-angle reflectivity can also be used to screen quantitatively for fluid and reservoir responses in your prestack data.

Chi 45° reflectivity for reservoir (left) Chi 20° reflectivity for fluid (right)
Can I go beyond reflectivity analysis?
Your Subtitle Goes Here

Extended elastic impedance (EEI) volume generation is the logical extension to prestack reflectivity attribute analysis, and is another integrated workflow in the QAI toolkit. Colored inversion operators are designed in the Wavelet tool to phase-rotate and spectrally shape Intercept & Gradient or Chi reflectivity volumes to produce EEI volumes at desired angles. Where reservoir targets lie within the tuning-thickness range of the seismic data, this approach provides a quick way to approximate relative elastic interval properties. Well log data can also be used to help determine target EEI angles for targeting specific reservoir properties such as Sw or Vclay.
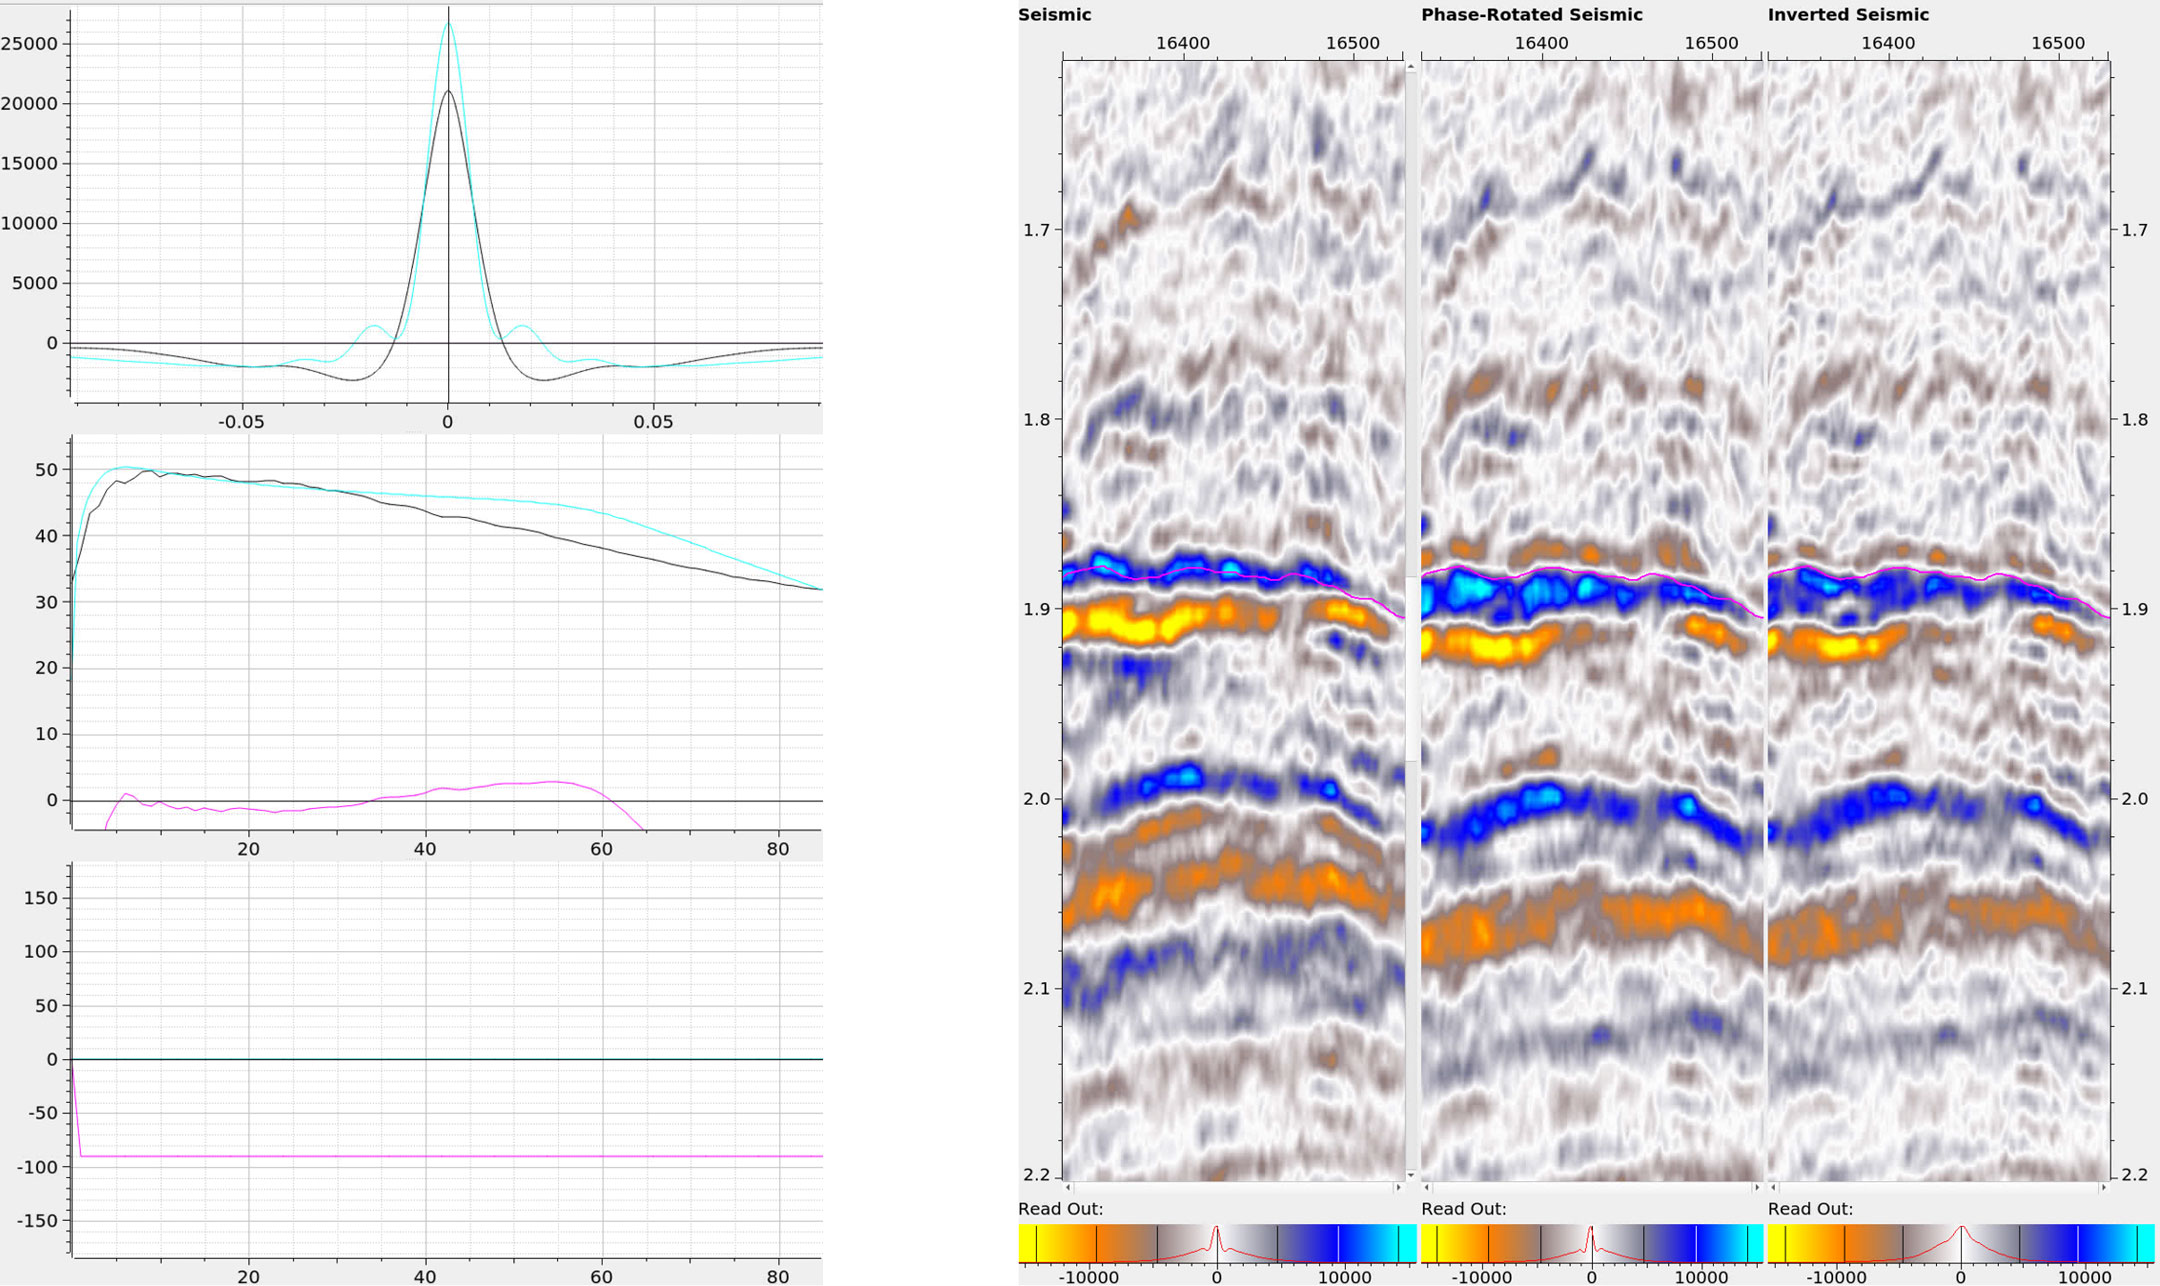
Colored inversion operator design (left) Colored inversion preview/parameter testing (right)

Relative acoustic impedance (EEI 0°) (left), Relative Vp/Vs ratio (EEI 45°) (right)
Are there any other prestack amplitude attributes I can use to interpret my reservoirs?
Your Subtitle Goes Here

A particularly powerful QAI tool is the interactive spectral decomposition. Spectral decomposition is a method of analyzing seismic amplitude response at different frequencies and combining the response at multiple target frequency bands to identify thickness variations within a target reservoir (the frequency at which an interval reaches peak tuning amplitude is dependent upon its thickness).
Sharp Reflections provides the additional capability of analyzing spectral decomposition on an angle dependent basis, directly from the gathers, facilitating the separation of angle dependent (fluid) amplitude effects from reservoir thickness effects.
- Interactive spectral decomposition directly from prestack angle gathers
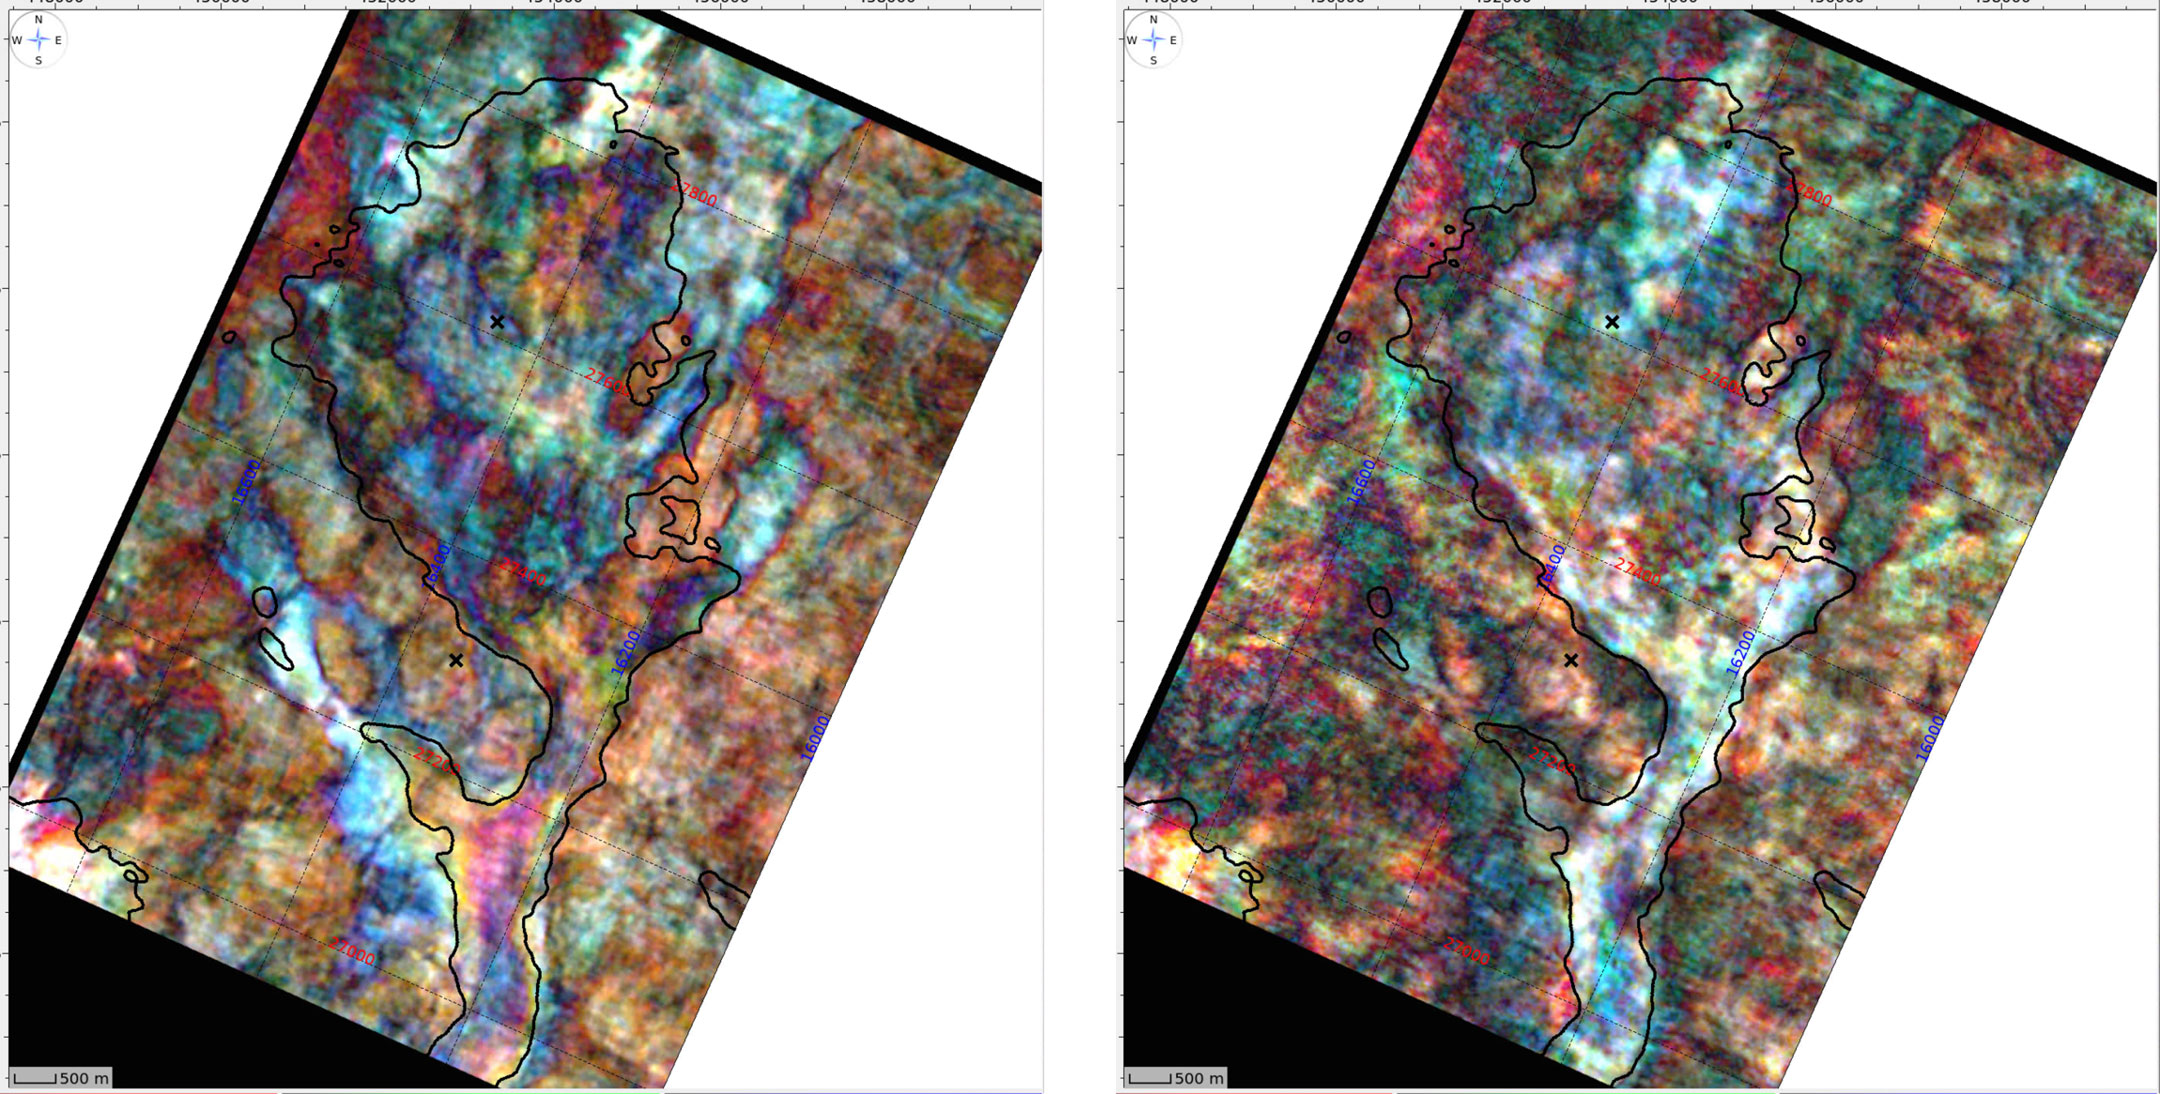
Spectral decomposition at target horizon 10° (left) Spectral decomposition at target horizon 50° (right)
I have multiple stacked reservoir targets in my study area. How can I most efficiently replicate my AVA analysis workflows for each target?
Your Subtitle Goes Here

The Sharp Reflections QAI toolkit allows you to work with multiple horizons in a single data object called a horizon deck. The deck can be a collection of interpreted horizons, or it can be a series of iso-proportionally interpolated surfaces between horizon picks.
Efficiency comes through the performance of operations using the horizon deck to compute attributes for all horizons in a single step. For example, with 12 input horizons in a deck and an angle gather volume with 60 angle planes, amplitudes can be extracted at every angle for every horizon in a single operation. The resulting 720 maps (12 horizons x 60 angles) are stored in a single data object for efficient screening of results and for use in further computations.
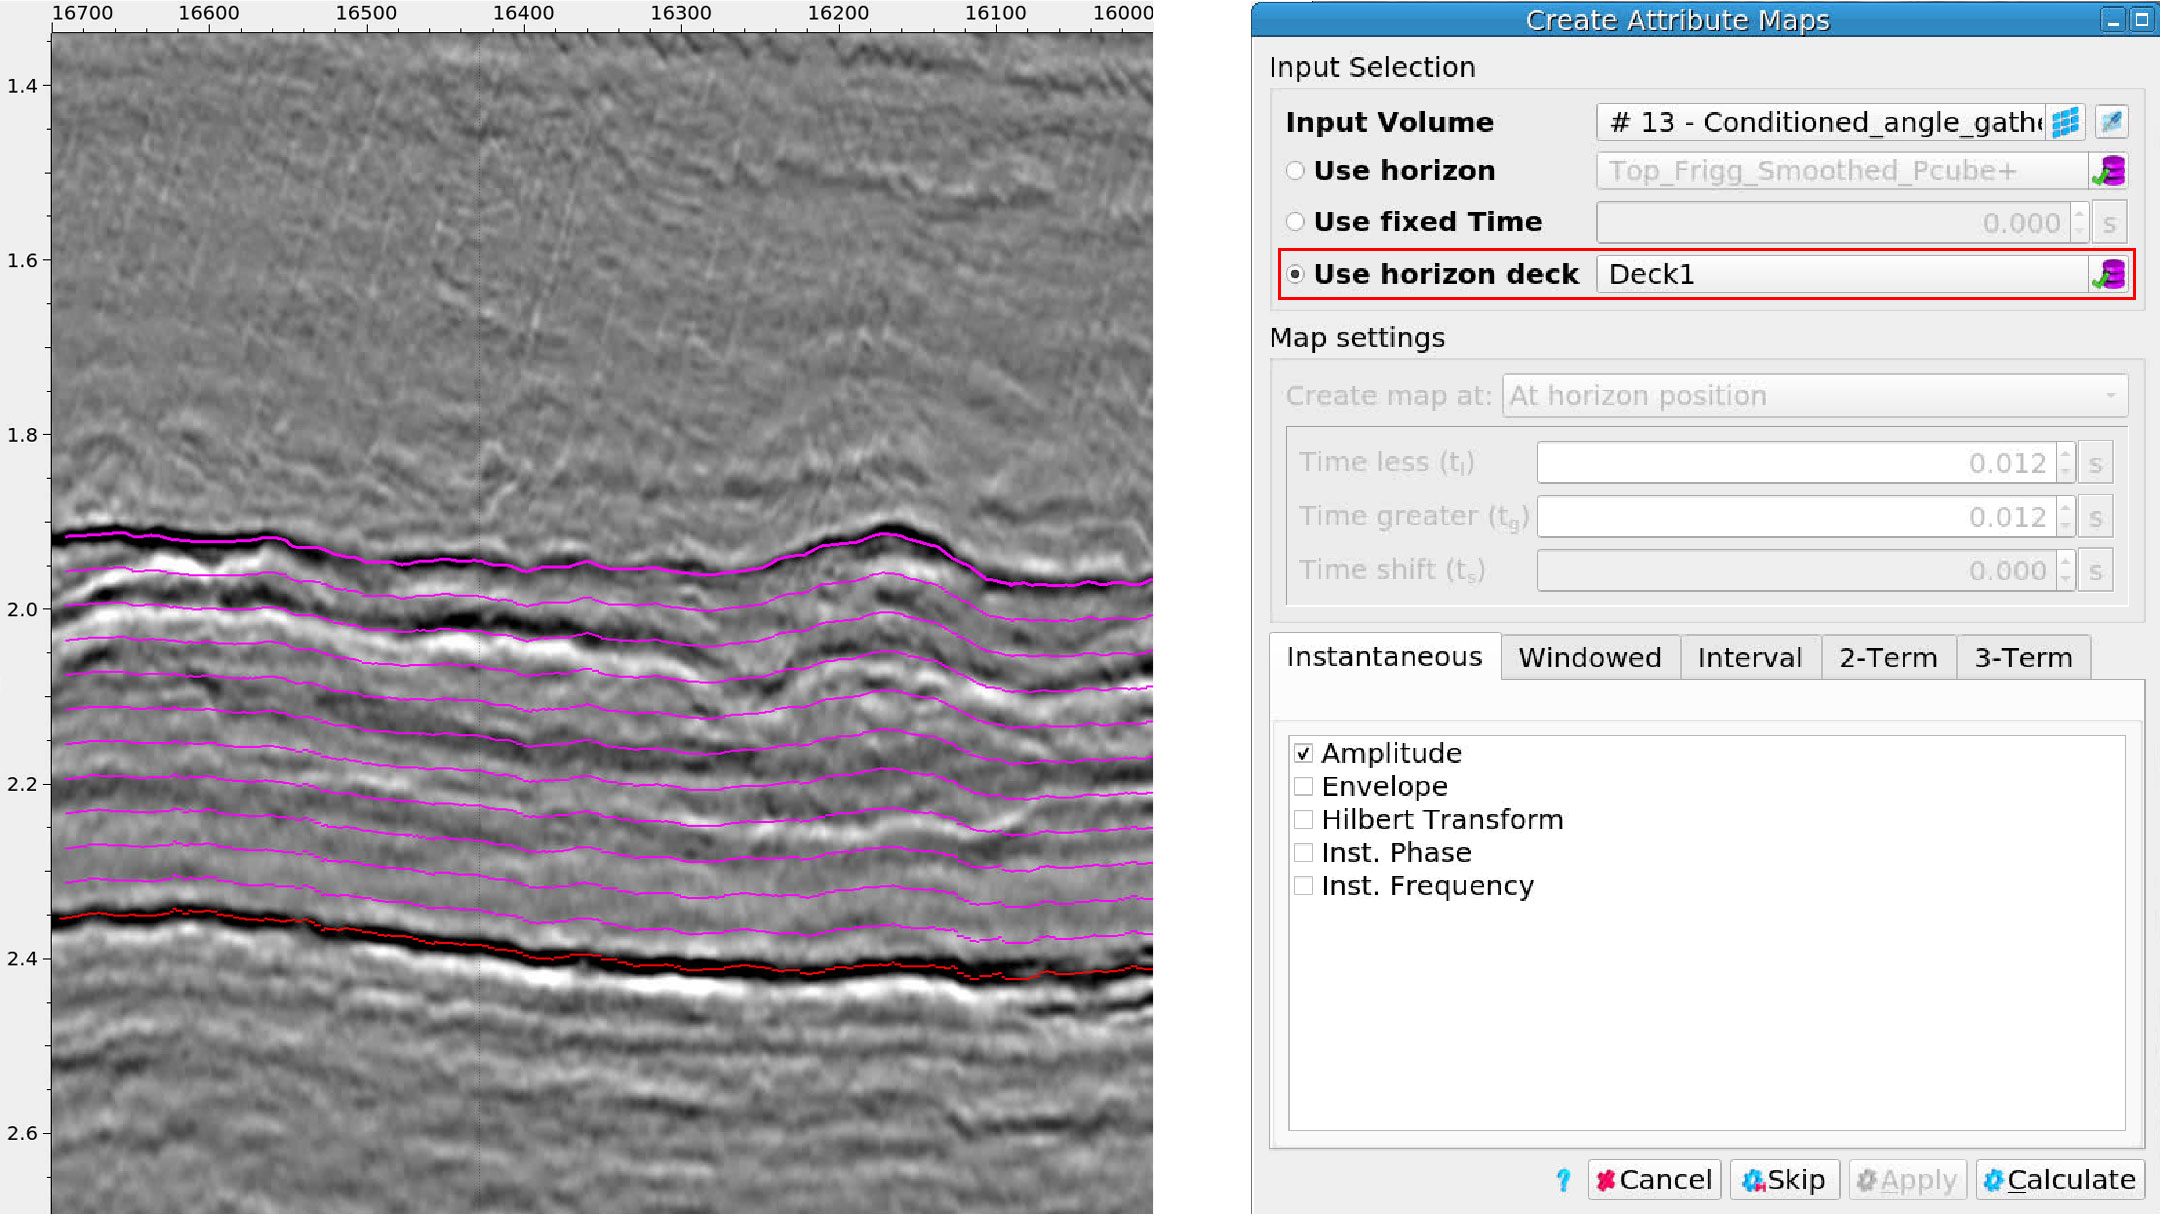
Horizon deck containing 12 horizons (left). Horizon deck attribute map creation (right)

Prestack horizon deck attribute maps can be interrogated by horizon and prestack attributes from a single, ordered data object.
Key technical capabilities
Offset-to-angle conversion and amplitude variation with angle (AVA) attributes
Compute angle gathers, stacks and AVA attributes from offset gathers
Generate poststack seismic attributes for structural and stratigraphic interpretation
Multidimensional horizon interpretation and attribute analysis
Seed and track events on stack
Extend 3D horizons to multidimensional horizons (e.g. along angles, azimuths, vintages)
Create multihorizon decks for rapid volume screening in defined intervals
Produce high-resolution maps of offset and angle attributes from prestack gathers
Seismic forward modeling and well tie
Model AVA scenarios with prestack synthetics and 3D parametric models
Calibrate seismic-to-wells with a complete prestack well tie tool
Design and manipulate wavelets, spectra and filters
Advanced cross-plotting
Interactively cross-plot well and seismic data for fluid and lithology trends
Create cross plots of well log data, create target zones for modeling, analysis and evaluation of rock physics trends
To learn from our experts how to do all this in a real project, sign up for this course:
Dive into the details

Prestack Data Enhancement
Optimize the reliability of your seismic data.

Quantitative Amplitude Interpretation
Sharpen reservoir insight with multistep QAI analysis.

Inversion
Improve reservoir delineation and net-pay estimation.

Azimuthal
Improve illumination and understanding of complex geological structures.

4D Time-Lapse
Identify poorly drained or bypassed reservoir sections.
All the data for the best decisions
Sharp Reflections is the industry’s only software platform built on a powerful compute and display engine designed specifically for HPC, for use on your premises or in the cloud.
Our integrated platform enables you to start analyzing and interpreting seismic data as soon as post-migration processing begins. No information is wasted as you reduce uncertainty and fine tune your reservoir characterization to help achieve trustable exploration, drilling and production decisions.
